Edit Grids

Customizing display grids

Interactive Grid Setup

To access this dialog:

  • In theSheetscontrol bar, expand theDesignorPlotsfolders so that overlays are seen. Right-click the [Default Grid] option and select ...Grid Properties.

  • In theSheets | active 3D window | Gridsfolder, double click an existing grid, or right-click the parent-level folder to create a new grid.

  • In the Project Data control bar, navigate to a grid item overlay in either the 3D or Map window section.

Your Interactive 3D Grid facility allows you to visualize your visual data tables in the  active 3D window orPlotswindow with a true dimensional context. Several display formats are permitted, from 2D flat grids to rendered 3D grids bounding a specified object, and for each style, a host of formatting options are available - for 3D grids see 3D Grids.

The Interactive Grid setup provides settings using the following tabs:

  • Options: basic grid options, including which axis/axes to portray, the format that is used for grid annotation and the type(s) of line(s) to be used for grid display. More...

  • Advanced Options: determine precisely how the axis/axes of a grid are to measured, i.e. what type of coordinate system, and set up how (or if) a grid is to be constrained in relation to a specific object in memory. More...

  • More Line Formatting: more options can be found here for defining the display format for grid lines. More...

Select a link above for more information on a particular area, or read below for background information.

Grids areOverlays

The concept of overlays is important to the Studio Interactive Grid, as a grid is a representation of a data object in the active 3D window orPlots window, and can be manipulated in a similar way. As with any overlay, the 'Default Grid' exists as an entry in the Sheets control bar (for more information on the visual hierarchy of your application, see View Hierarchy).

Grids are used to indicate the overall dimensions along any of the view axes (XYZ). One of the limitations of a standard flat grid is that it is often difficult to sense or interpret the extent of a 3D data object in a direction that is not orthogonal to the view. In the past, this conundrum has been resolved by allowing non-orthogonal grids to be viewed in the Design and Plots windows, and this type of measure is a very useful aid for denoting a measurement that is perpendicular to the viewing direction. For example;
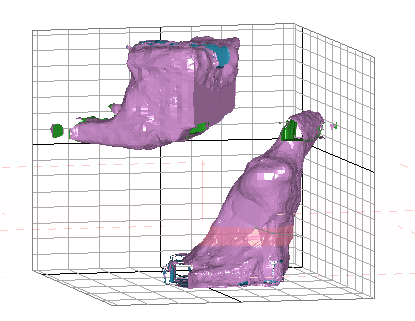
The display above shows grid lines superimposed for all 3 axes. In this situation, it can be difficult to determine the information the grid is presenting. your application's Interactive Grid facility resolves this by creating a grid as (optionally) a 3D data object. The same geological model, when rendered in 3D, with a 3D grid overlay is much easier to interpret as it gives a more visually informative feedback of the dimensions of the model:

Grids and 'North' Arrows

Your Plot Item Library permits you to associate a 'north' arrow with a grid. This arrow, although it will always face to the north of the grid, can be used to set up any directional arrow on a plot. This is possible as the default 3D grid overlay in the Plots window can be associated with an arrow plot item.

Please note that the appearance of the Grid Properties dialog, whilst essentially similar in both the active 3D window orPlots windows, is not identical; the  active 3D window version features a facility to add a direction-indicator arrow to the grid being defined, whereas in the Plots window, directional arrows are added using the Insert | Plot Item | North Arrow option or by selecting the context-sensitive Insert option for a sheet projection.

Once added, this arrow can be managed independently of the world coordinates represented by the projection. If a local coordinate system is selected for the grid (in the Plots window. using the Format Display right-click option for a projection when not in page layout mode, and selecting the Grid tab) the coordinate system of a grid can be set independently from that of the 'world', meaning that you could, if you wished, add a directional arrow to indicate any position in relation to the sheet (e.g. Magnetic North).

As any number of arrows can be added to the grid and/or world, multiple positions can be easily generated. To remove the relationship between the grid and the world coordinate system, you would need to select the Use Local Coordinates option on the Advanced Options tab of the Grid dialog. Then, the local coordinate system for the grid can be defined, allowing you to allow the arrow to point anywhere.

Can a Grid be a Single Line?

Sometimes, it can be useful to add a 3D 'ruler' to the screen. The single line option for a grid is simple to implement for any of the view axes; you decide at which position you wish the line to appear, and then you set both minimum and maximum extents to that value. For example;

  1. In the3Dwindow, the volumetric centre point of a block model is located at 4250 meters in the Y direction (that is, 4250m from the world origin). Right-clicking theGridsfolder in theSheetscontrol bar gives you the option to introduce a new grid overlay to the view

  2. Select the [View Plane] option from the Grid type drop-down list.

  3. Accept the remaining defaults on the Options tab and click the Advanced Options tab.

  4. In the Constraints group, select both Y axis fields and set both Minimum and Maximum values to 4250.

  5. Click Apply and the single-line Grid is shown. You can now edit the available options to edit the appearance of this line (e.g. to show a specific interval, major and minor lines etc.)

Grid Types

The grid type is selected from the Grid Type drop-down list. The following basic grid types are supported - bear in mind that each grid type can be independently configured, and all grid settings are saved with the project:

Grid

Description

Horizontal (XY)
This grid can be shown as an infinite or restricted plane in X and/or Y directions. No indication of Z dimensions are shown.

East-West (XZ)
This grid can be shown as an infinite or restricted plane in X and/or Z directions. No indication of Y dimensions are shown.

North-South (YZ)
This grid can be shown as an infinite or restricted plane in Y and/or Z directions. No indication of X dimensions are shown.

Viewplane
Shows a grid representing all activated axes, aligned to the viewplane (the view that is orthogonal to the data being viewed).

Section Plane
For the currently defined (and active) section, a grid is applied showing up to 3 axes. This grid is not necessarily orthogonal to the view, instead it is shown aligned to a section - meaning the grid 'plane' can be seen at a non-orthogonal angle.

3D Hull
This option allows all 3 grid axes to be visualized as planar regions. Grids of this type can be infinite in 1 or more directions, or restricted to defined dimensions in any of these directions. The 3D grid can be shown bordered or otherwise, and with or without shading. As with all other grid settings, you can 'snap' the grid to the boundaries of a selected object or extend the planes to a custom or infinite extent in any direction.

Custom
Create your own grid using this option. You can display a grid in any of the XYZ directions using any of the properties available.

  openbook.gif (910 bytes)   Related Topics


Interactive Grid Options
Interactive Grid Advanced Options

Interactive Grid - More Line Formatting

Coordinate Systems Concept

North arrows

3D Grids